Like you’ve all probably noticed when surfing the Web, some eCommerce websites, as interesting as they may be, often neglect their design and their page disposition. Indeed, the design of a website virtually represents the ambiance, atmosphere, and quality of the company, just like a physical business.
In this guide to eCommerce design you’ll learn everything you need to know for making beautiful ecommerce sites that fulfill their main purpose: to sell your products! All based on eCommerce metrics.
But first, keep in mind this is a special eCommerce design blog. We’ll go through some metrics and analytics that are vital for online stores, however a minority adapt it. And for a second part, I’ll go through how to optimize your product and category design, based on your key performance indicators or KPIs.
Let’s go through some product metrics, which can provide valuable information for you, so later on you can edit and adapt your product page design.
The first step you need in this, is to identify the different types of products based on their conversion rate and performance.
DIFFERENTIATE & RANK YOUR PRODUCTS
In the first hand you need to differentiate into 3 sections:
- Start products: are the best-performing products in your store
- Need to improve: these are usually below average in term of conversion
- Inactive products: AKA the non-selling products
Highlight your star products on your homepage:
Once you identified your product into 3 segments based on their performance, your job here becomes super easy for the design optimization and which products to feature on the home page or in banners (obviously the star product).
Audit your products that had a lot of visitors but no conversions:
Now you can make the best out of your best selling products or ‘trending’, you can allocate more time to boost the products that require some improvements. For this you should be thinking about these questions:
- Do you provide enough information in your product description?
- Is the layout of your product page logical with easy-to-find elements?
- Are there enough photos with a high enough resolution?
- Does the design motivate a purchase?
When one of your products performs actually poorly, there can be several reasons for this. One possible problem can be that given product’s page is badly built, that its contents might have “fallen apart”, which raises difficulties during the purchasing process. As, in a web store, there can pop up such glitches that hit only a single item, or a single group of items, and you will not notice at first view that there is an actual problem on the page. This makes it important that, from time to time, you should check the contents of such product pages.
In addition to your top products, you should also measure your top performing categories. This KPI can tell you which categories to feature on your main page, and the best way to group your products for your customers.
BOOSTING CONVERSION BY CATEGORY OPTIMIZATION
These metrics show you which categories had a purchase during a specific time period and which did not. Use this KPI to see which categories perform better at specific times of the year, and then feature these categories during those times, or create a promotion for your customers a few weeks in advance to boost your sales.
Measuring KPIs is important step towards reaching your business goals. To really grow your business, you need to monitor the performance of your store. Here is why.
Once you collect all your important metrics for your online store, and here I am talking about the product and category performance metrics, you can build on it and turn these data to information, and by the end you transform these information into actionable tips that would help you optimize your product and category page design.
The optimization at this stage would serve for the benefit of boosting your conversion rates, by changing the design to boost the sales performance of your inactive or cold products, or boosting your best selling products and and use its design and images for home pages.
DELETE OR PROMOTE YOUR INACTIVE PRODUCTS
While keeping an eye on your sales performance and suddenly you see the numbers are dropping down. when the number of your customers is falling can mean the end of season.
Most online store owners determine the run-out of seasonal products only by mere intuition or a reducing stockpile. Even so, if you launch discount sales earlier than needed, you might drop off your full-prize buyers.
Thus, you should analyze the sales figures in the first place, and start the end of the season discounts only when there is a lasting drop of incomes. If you follow this scheme, you will not sell beneath the required price tag.

Here I am switching real quick from the numbers and metrics’ side to designs’ side because if I’d have to pick one single thing that would sell a product online, it’s images.
You ‘technically could’ have an ecommerce site with just images, and no product descriptions (I don’t recommend it). However, it wouldn’t work vice versa.
Limit your products on your category page:
One last tip that I believe it has a huge impact on your category page. Limit the number of products in each category to a reasonable number so your category pages don’t feel crowded with long lists of products. This way customers can more easily find the specific product they need. Review purchase behavior to see which products should be included in each category. Also consider how your customers shop for your products. While the features of each product may be helpful to create categories, for instance “Leather”, “Knit” or “Rubber” for a line of gloves, the use or benefits may create more relevant categories for your customers, such as “For Winter”, “For Driving” or “For Gardening”.
Design your category pages so that customers can clearly see the available products. Avoid having too much text above your products. Use high resolution images with relevant keywords in the titles, and then provide more detailed descriptions below. For instance, “Our Most Powerful Gaming Laptops” should appear above a nice high resolution image of the product line, with details about the specifications or benefits below, such as “2 x’s the memory of last year’s model”, or “Ready to play the latest games right out of the box”.
HOW TO USE IMAGES/ILLUSTRATIONS
People want to see what they’re getting. The grandfather of boosting eCommerce conversion rates is having high quality photos of your product. The more the better. Show the products from different angles, in context, make them zoomable.
Not only images, the design, colors and shapes can affect your visitors’ decisions.
By that I mean the graphical elements and visual appearance of your eCommerce website should fit your audience. A site aimed at a younger audience, for example an online toy store, should be colorful and vivid, while a site targeting a more conservative or older audience should be less flashy, less colorful, and more elegant.
When your primary audience is men, feel free to use colder colors such as blues and grays,. For an audience made up mostly of women, consider using warmer colors such as a deep red or rich shade of brown.
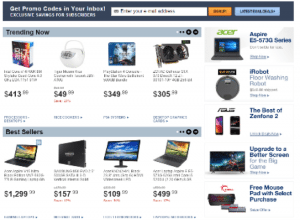
Here is an example, the leading US-based online megastore newegg.com has successfully adapted this method.
From the landing page of the store, from a separate module, some best seller (star) products can conveniently be reached by the customers. Through a single click, the visitors coming to the landing page can overview the features of these items. This significantly cuts back on the time needed to reach out to a particular product, in this way your general conversion rates can considerably upsurge.
The tips mentioned in here approached eCommerce from an analytic perspective but, for a successful ecommerce website, your design and sales efforts should complement each other.
In order to receive crystal clear data about your category and product, use www.conversific.com so you can optimize your online store in a way that is sustainable, since it is based on metrics and KPIs.
Conversific is a Business Intelligence platform that help eCommerce site owners to unlock hidden revenue in their data and boost their store’s performance by delivering actionable business insights.
Here is the solutions it provides:
- All important ecommerce based data in one place.
- In a comprehensive but easy-to-understand way.
- Smart insights about products, categories, marketing channels and customers.
- Actionable tips and advices from eCommerce gurus about what to do with the data.
Beyond opportunities of increasing sales, you can also identify the bottlenecks where your business is losing money. Data-based optimization is the key to reducing your costs and growing your business.
After the installation, you just need to enable Google Analytics and Google Search Console Connection. Immediately after you’ve signed in, you’ll see a comprehensive view of your reports and dashboards.
CONCLUSION
Measuring KPIs is important step towards reaching your business goals. To really grow your business, you need to monitor the performance of your store. Once you’ve decided which KPIs you want to track, make it a part of your daily, weekly or monthly routine. And build on it till all your business decisions are extracted from your metrics.
About the author

Szilard Vajda is an eCommerce specialist, founder of Conversific. He was COO at a company that specialized in building ecommerce sites and providing SEO for online stores. Thanks to that experience, he gained first-hand knowledge using the latest Search Engine Optimization techniques to increase sales.
His main goal is to help ecommerce store owners take their business to the next level, focusing on big data and business intelligence tools.